Infographics

Click on the picture.
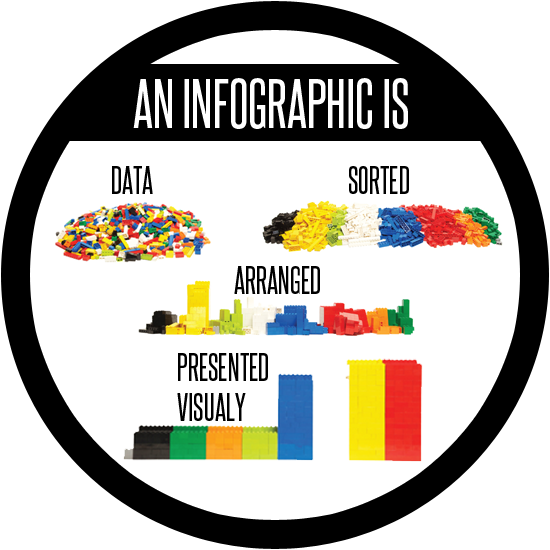
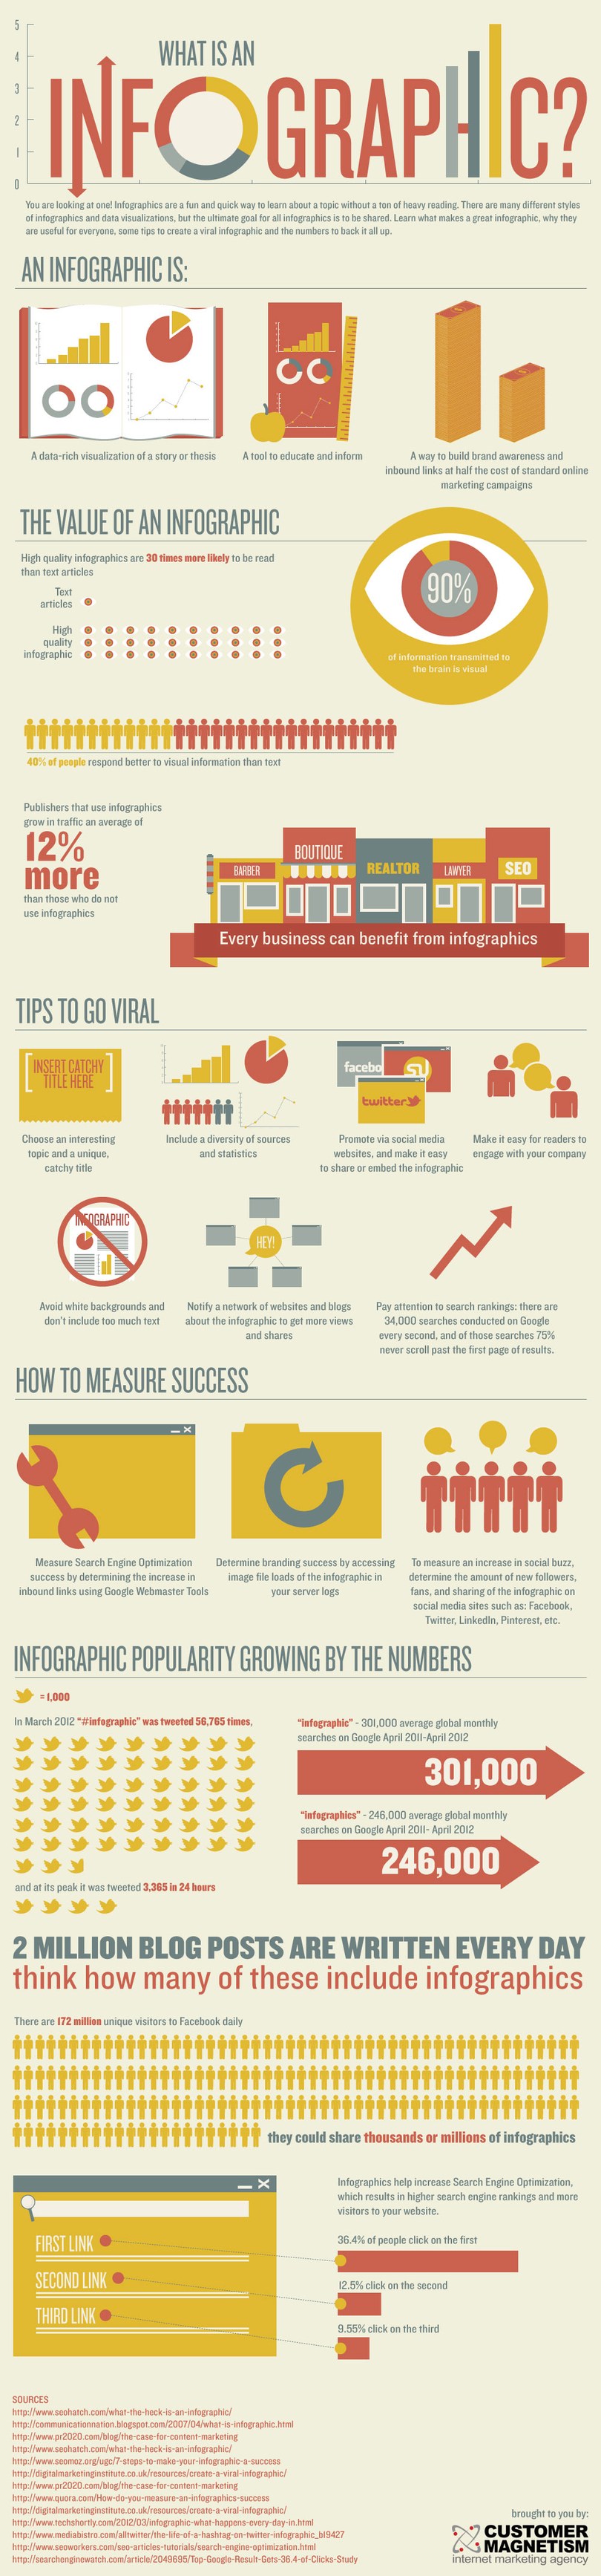
Step One - What makes a good infographic?
Look online for an infographic. Any infographic will do as long as it's not a template for an infographic.
You can either take my search or you could search for something more specific.
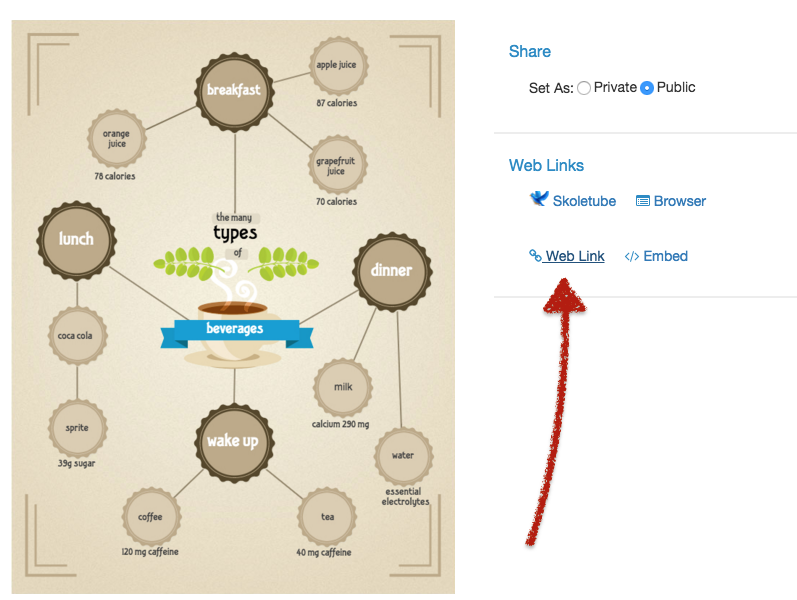
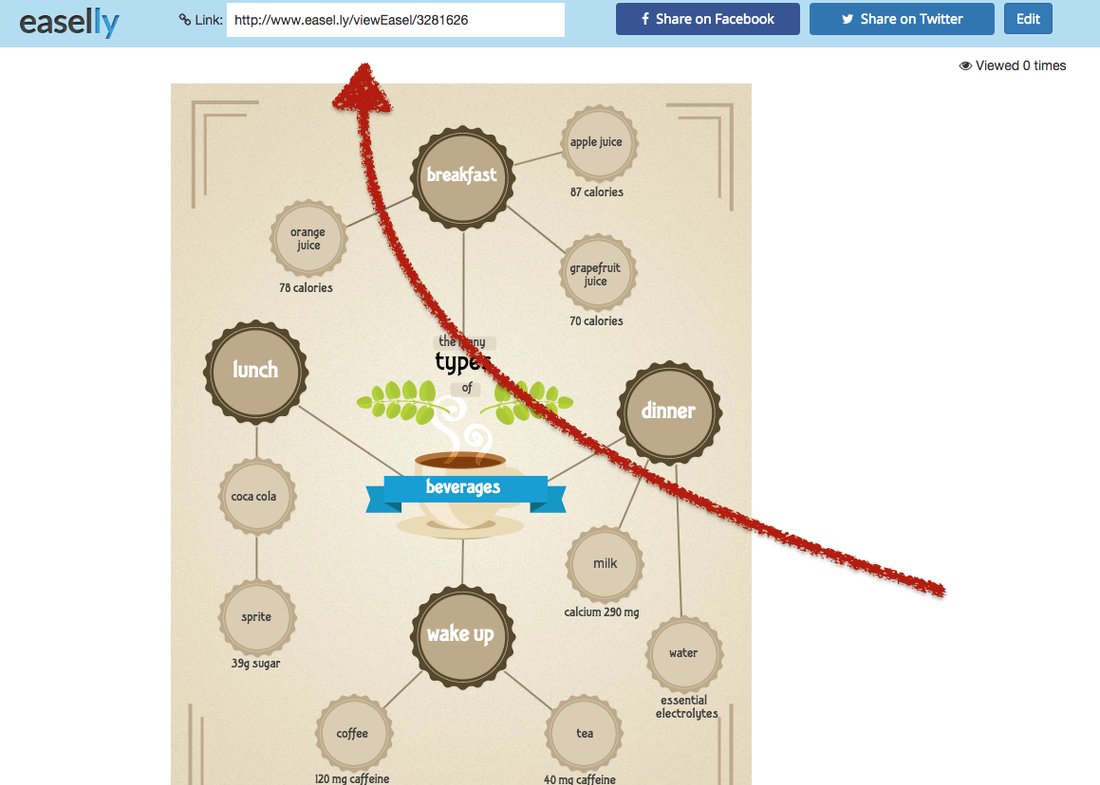
Email me the infographic that you are choosing to analyze. You can save it as a file, take a screenshot of the whole thing, or send me a link.
[email protected]
With your email include the complete answer to these questions:
You can either take my search or you could search for something more specific.
Email me the infographic that you are choosing to analyze. You can save it as a file, take a screenshot of the whole thing, or send me a link.
[email protected]
With your email include the complete answer to these questions:
- Is the title or main idea clearly stated? What makes it so clear?
- Is the content relevant to the topic? How or how not?
- On a scale of 1-4 (4 is excellent) how easy is it to follow the graphics/content?
- Do you think that the graphics add to the topic or make it more confusing?
- Are there spelling or grammar errors?
- Is the infographic attractive overall? What design elements did the creator(s) include to make it attractive?
- Did they site their sources?
Step Two - Decide a topic for yourself
Lucky for you, it's IP season! You could choose to use your topic since you've already done research on it. Or, if you wish to look at another topic and find info on that, be my guest.
Step Three - Collect data and information
Focus on finding information that can be represented visually. If you look at a lot of infographics, you'll notice that there aren't too many words and there are a lot of graphs, charts, and representations.
Don't forget to cite those sources. Don't know what I mean? Go back to Week 14 in the Tech Center.
Don't forget to cite those sources. Don't know what I mean? Go back to Week 14 in the Tech Center.
Step Four - Begin to build your Infographic
Go to Easel.ly and create an account. You can use your school email account.
How do I do this?
How do I do this?
- Watch the video on the Easel.ly website
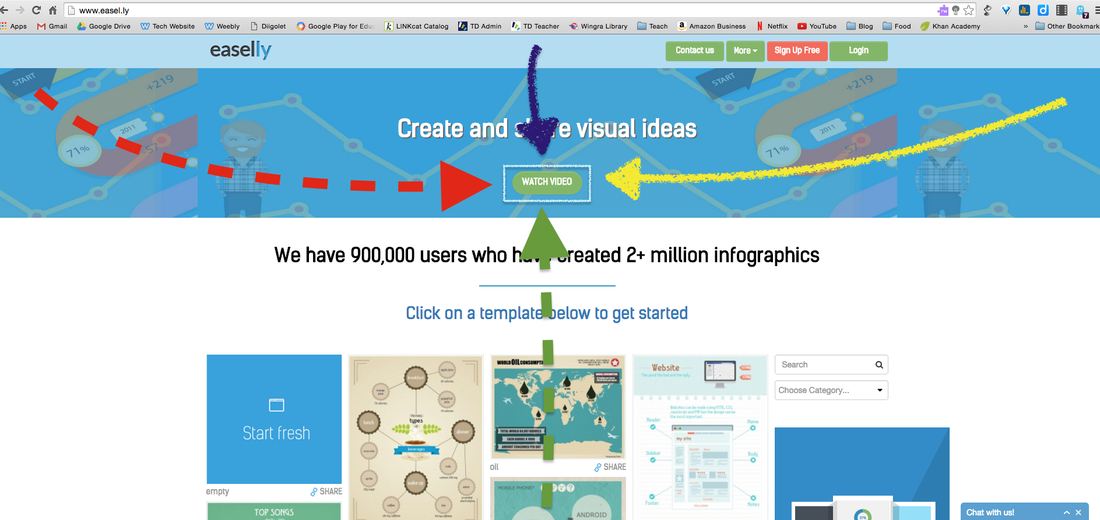
- Watch either video on the Easel.ly tutorial
- Look at this PDF that I found on Easel.ly's website
- Use your super skills of deduction and reasoning to figure it out yourself (or Google it yourself)
- Come find Andrea during your Tuesday afternoon work time. She loves to help! Yay!
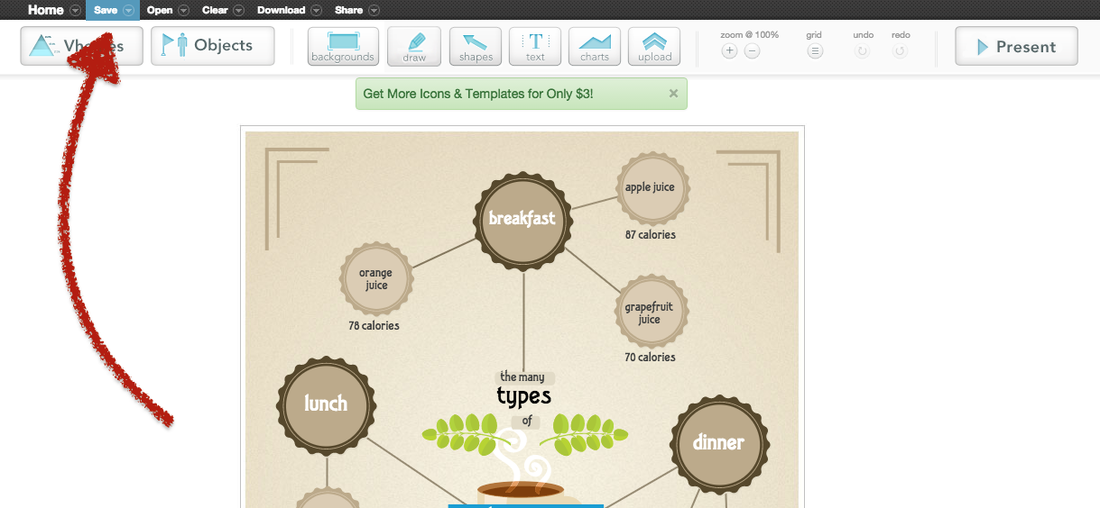
YOU NEED TO SAVE YOUR INFOGRAPHIC BEFORE CLOSING.
THIS IS NOT GOOGLE. IT WILL NOT AUTOSAVE.
THIS IS NOT GOOGLE. IT WILL NOT AUTOSAVE.
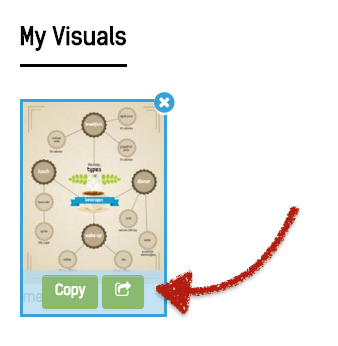
Step Five - Submit your completed infographic
After you've saved your 'graphic, you will be taken to a page that holds all of your projects. Hover your cursor over your completed project.