Excel and other spreadsheets
Level 1 - - - creating a spreadsheet, columns and data input
In order to use data, you need data to use! Come up with something that interests you. You could choose to have a class survey (you could do more than your class, but you need to find a time to survey those people), find a correlation between people's interests, investigate a study, follow your stocks, or come up with something else.
Now that you have data, you will need to organize it in a spreadsheet. Open Microsoft Excel. Give an appropriate label to your column(s) and rows.
Level 2 - - - creating a chart and formatting charts
To create a chart, you will need to highlight the information that you wish to represent. The next step is to choose which type of graph or chart will work best for what you are trying to show. Do you want to use a pie chart to show a percentage? Do you want to use a line graph to show a correlation or trend? A bar graph to show a majority? Think about the question that you asked at the beginning.
Choose the chart type that will work for your data. It will represent the data how you put it in. Sometimes, you have to edit your data, maybe move columns around, to make the graph say what you were intending. If you right click on your graph/chart, a menu will appear. Be sure that your graph/chart has a key/legend and the appropriate labels and title.
Level 3 - - - Make it do your math and tedious work
Sometimes, you have to input things into a spreadsheet which may feel tedious. Adding the columns 1, 2, 3, 4, 5, etc., for example, may get boring after a while.
Fun Fact: you don't have to do that!
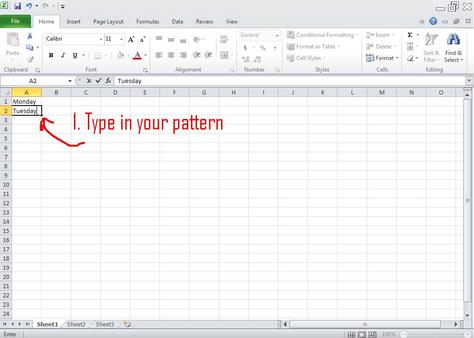
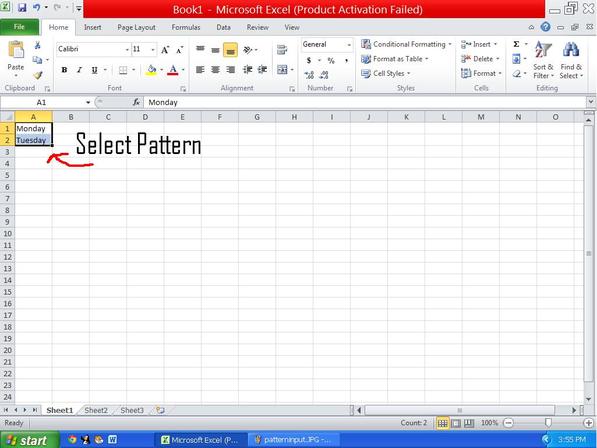
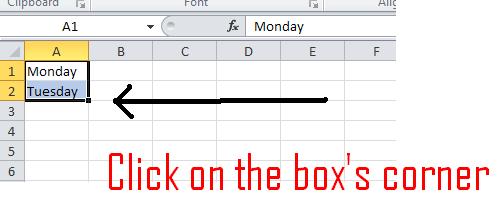
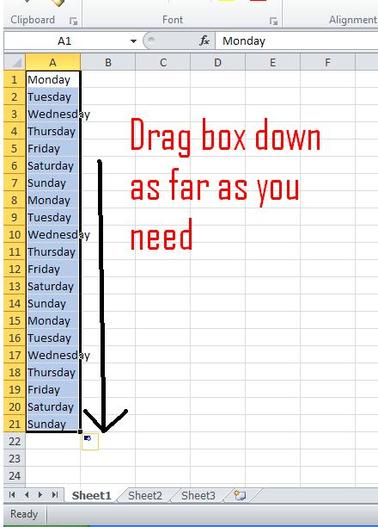
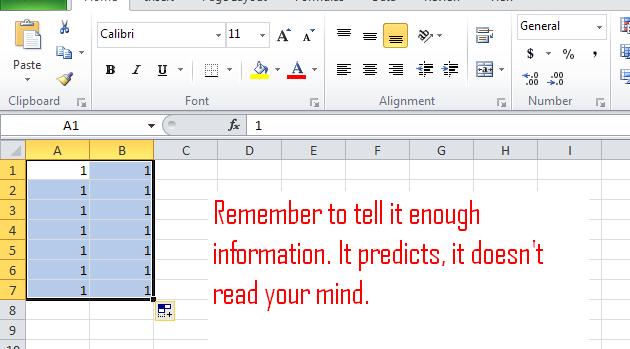
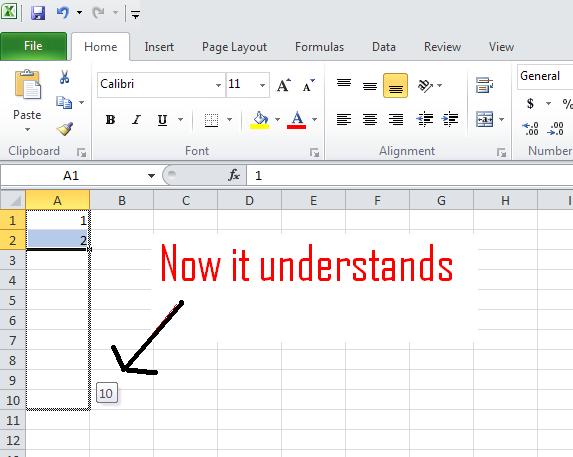
If you type in just enough for the program to understand your pattern, it can fill it out for you. If you were trying to type in the days of the week, you could type in Monday and Tuesday. Stop. Highlight Monday and Tuesday. On the lower right hand corner of that highlighted box, there is a tiny little box. Carefully click on that box and drag it down. What happened!
Try it again with numbers.
Try it with dates.
Try it again with numbers.
Try it with dates.
|
|
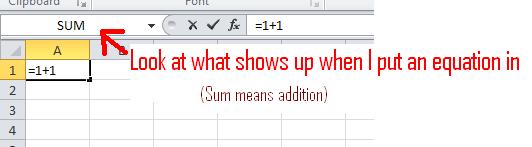
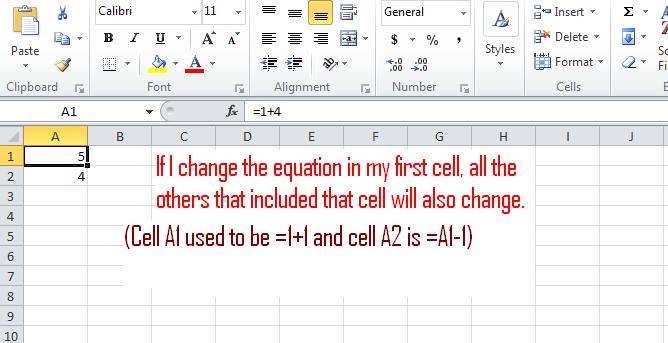
Excel is more than just a place to put data before making into a graph/chart. It is a fancy calculator. In a cell, type in '=1+1' and hit enter. What happened? That was easy, right?
Try it with a harder number.
Try it with subtracting.
If you want to multiply or divide, use an asterisk (*) for multiplication and a forward slash (/) for division.
Keep in mind, if I wanted to find out how many times 2 goes into 10356, I would type '=10356/2'
Try it with a harder number.
Try it with subtracting.
If you want to multiply or divide, use an asterisk (*) for multiplication and a forward slash (/) for division.
Keep in mind, if I wanted to find out how many times 2 goes into 10356, I would type '=10356/2'
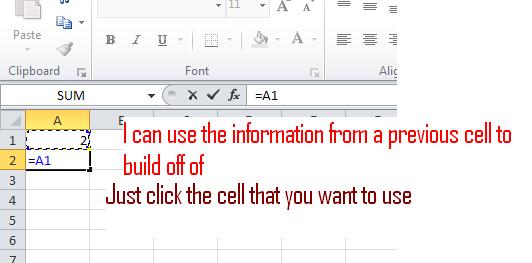
Remember to put the equal sign before the equation.
This is how Excel knows you want it to do the math for you.
This is how Excel knows you want it to do the math for you.
Okay, so what? It is a large and inconvenient calculator. My phone does that too.
It gets better.
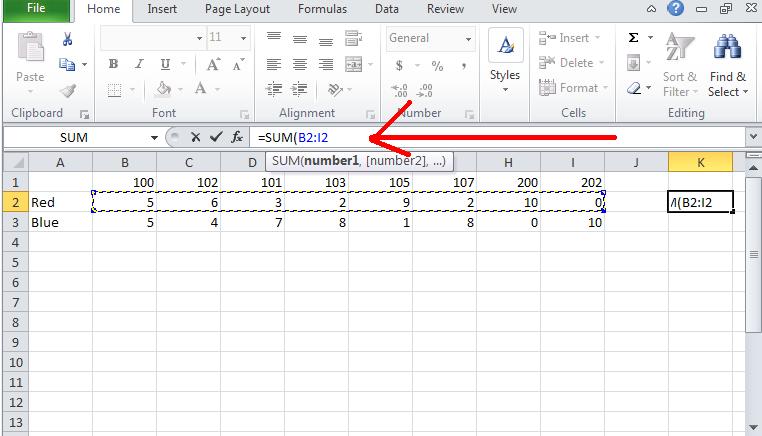
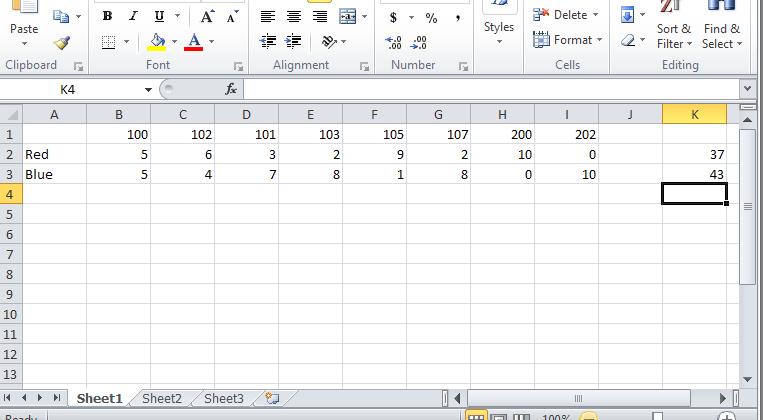
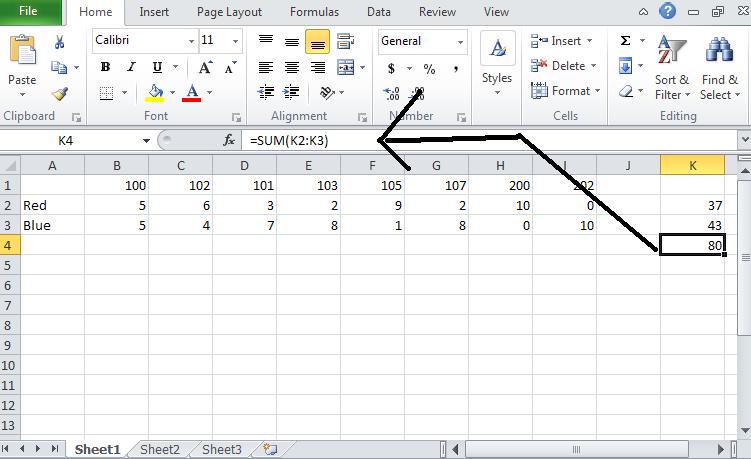
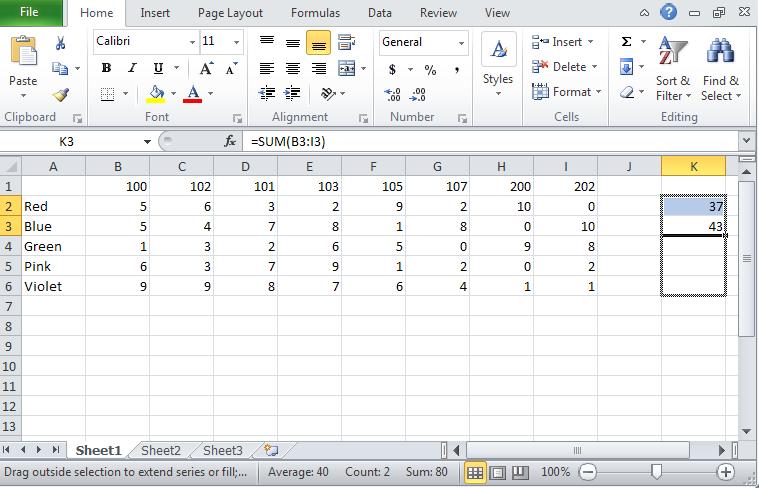
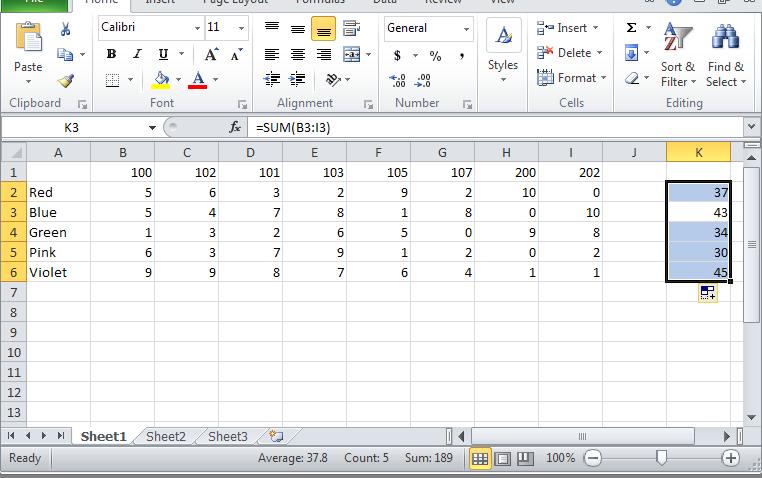
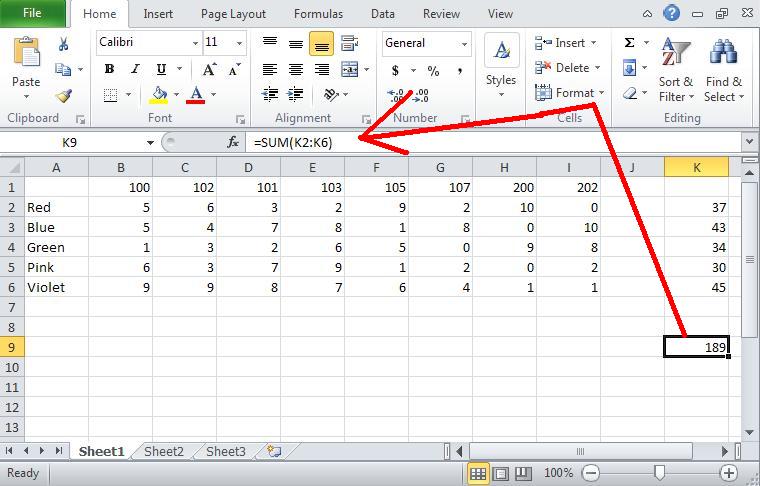
You can have it do a series of math problems in the same way that it recognized patterns before.
It gets better.
You can have it do a series of math problems in the same way that it recognized patterns before.
|
|
Level 4 - - - other spreadsheets (Numbers)
how to create charts
how to create math equations
how to numbers basic
how to create math equations
how to numbers basic
